If patterns of globalization over decades could be plotted on a world map, what might they look like and what deeper insights might they reveal, wondered Miguel Centeno.
Jeanne Altmann and Catherine Markham, on the other hand, wanted to understand how groups of baboons in the Amboseli basin of East Africa were coping with their changing environment.
John Haldon wanted to analyze the impact of ancient armies on the landscape of bygone European and Islamic worlds.
Emmanuel Kreike hoped he could recreate decades of environmental change from the 1940s to the present in southern Africa, with the goal of generating a "virtual historical world."
And Adam Burrows, confronted with a massive data set representing a simulation of the last moments of an exploding star, speculated that he could learn so much more if he could really just "see" it.
Centeno is a professor of sociology and international affairs. Altmann is a professor of ecology and evolutionary biology, and Markham is a graduate student in the department. Haldon is a professor of history and Hellenic studies. Kreike is an associate professor of history. And Burrows is a professor of astrophysical sciences. They may hail from different departments and disciplines. But they have become equally convinced of the importance of scientific visualization as a cutting-edge research tool, and they have sought out the same new place on campus in which to launch their queries.
The Visualization Laboratory, created by the Princeton Institute for Computational Science and Engineering (PICSciE), opened its doors in September. Its founders will host an open house on Thursday, Dec. 3, at the lab in Lewis Library (see sidebar).
"We hope this will be a facility that will be used by the entire campus community, by people from all fields, including arts, humanities, social sciences and other sciences," said Jeremiah Ostriker, the astrophysics professor and former director of PICSciE who was integrally involved with the lab's creation. "Give it a try. And if you like it, come back and use it some more."

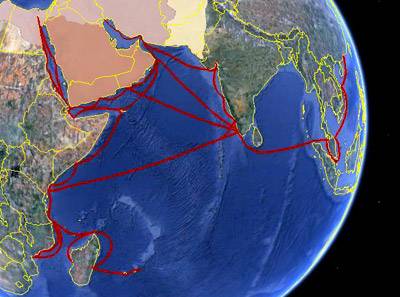
This still image of a visualization produced by Miguel Centeno, professor of sociology and international affairs, in conjunction with the Visualization Laboratory, grew out of his 2007 class, "Mapping Globalization." Among other goals, the students were taught to think of globalization as a process that has gone on for thousands of years, often without western Europe at its center. The image combines different maps showing Muslim trade routes and the boundaries of caliphates, which were traditional Islamic forms of government that existed for centuries. The caliphates are indicated in different shades of pink in the upper central part of the globe, and the red lines represent their trade routes. The yellow lines show the modern borders of countries. (Image: Miguel Centeno/Visualization Laboratory)
Hefty data-crunching power
Scientific visualization is an interdisciplinary branch of science that is concerned with the presentation through computer-generated images of three-dimensional phenomena, from architectural drawings to meteorological trends, with an emphasis on realistic renderings of quantitative information including surfaces, volumes and light sources. Time is often an important component, contributing to making the images "dynamical," as well.
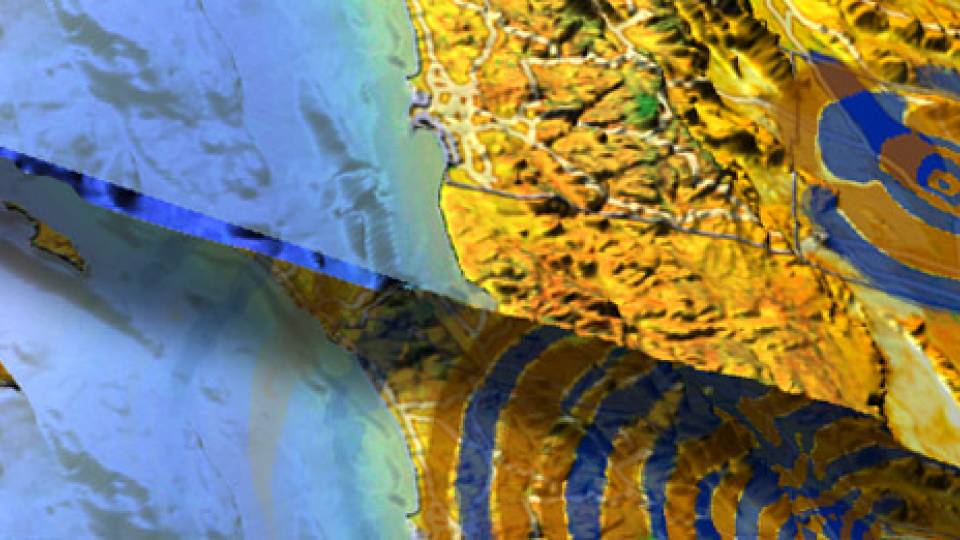
"Scientific visualization is an incredibly powerful tool because it allows us to represent data graphically to gain understanding and insight," said Jeroen Tromp, the Blair Professor of Geology and the director of PICSciE. He is using the center to perfect predictions on how the Earth's crust -- and the buildings above it -- might be adversely affected during an earthquake.
Through the center, he is building models that simulate what happens to a landscape in the aftermath of an earthquake. By comparing his simulations to real aftereffects, he is able to improve upon his models, a process called optimization. The work ultimately could lead to a better understanding of the potential impact of earthquakes on engineered structures through quantitative seismic hazard assessment.
Behind the scenes, the lab draws its hefty data-crunching power from six powerful University computers, some considered supercomputers and others operating on a massively parallel basis, according to Curtis Hillegas, who oversees the facility. He also serves as director of Terascale Infrastructure for Groundbreaking Research in Engineering and Science (TIGRESS) in the Office of Information Technology.
What users see when they enter, however, is a large movie-type screen, 105 inches tall and 198 inches wide lit from the rear by a 10,000-lumen projector. With its capability of displaying 8.8 million pixels, the screen shows about four times as much information as a standard office computer monitor. The lab contains tables and seating for 50, so there is plenty of room for groups of researchers to collaborate.
The results, Hillegas believes, are extraordinary. "You can almost walk into your data," he said.
Staff members can help researchers at their offices, setting up software on their computers to get them started on visualization techniques that can then be transferred to the larger setup.
"We want this to be used for discovery, for instruction, even for the 'wow factor,'" Hillegas said. "We really want it to be used by the community as much as possible."

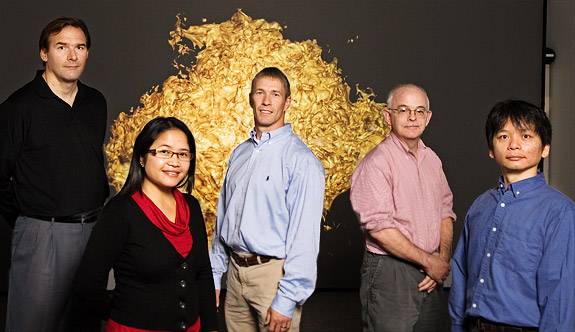
The Visualization Laboratory, created by the Princeton Institute for Computational Science and Engineering (PICSciE), opened its doors in September. Some of its founders are (from left): Jeroen Tromp, the Blair Professor of Geology and the director of PICSciE; Florevel Fusin-Wischusen, institute manager of PICSciE; Curtis Hillegas, director of the Terascale Infrastructure for Groundbreaking Research in Engineering and Science (TIGRESS); William Guthe, coordinator for geographic information systems and remote sensing; and Simon Su, a visualization analyst. (Photo: Brian Wilson)
An art and a science
Several faculty members already are working closely with the center's staff members, such as Simon Su, a visualization analyst, and William Guthe, coordinator for geographic information systems and remote sensing.
"Visualization helps researchers to better understand their data during the discovery process," Su said. "It is both an art and a science that provides the right level of abstraction to enable researchers to derive meaningful interpretation from their research outcome."
The technology has moved from static, two-dimensional plots to interactive, three-dimensional images projected onto a screen. Su can envision a day, not too far away, when the large screen grows to cover the walls, floor and ceiling, creating a fully immersive "cube."
Guthe said the technology represented a natural progression for him. As a geographer, he has always loved maps and enjoyed visualizing information. Scientific visualization takes it a step beyond, he said, helping investigators map previously unknown terrain, whether it is a morphing Earth, bouncing molecules or bursting stars.
"Maps are representations and interpretations of reality, selecting out the significant from the overwhelming amount of detail we see around us," Guthe said. "The Visualization Laboratory allows all researchers to see significant patterns and processes in their 'landscapes,' whether the landscape is Anatolia in the medieval period, the Angolan-Namibian border region in the 20th century, or surfaces of varying temperature and pressure in an atmospheric model."
For his studies on globalization, Centeno is banking on visualization techniques to clarify matters.
"Part of my work has been to create a better empirical and analytical base for discussions of globalization," Centeno said. "A lot of silly things get said on all sides, and I thought that a public data source with visualization of some of the issues would be helpful."
He credits the staff of the Visualization Lab and OIT's Academic Services for giving him such a strong start. Centeno's mapping globalization website already receives hits from all over the world, as well as requests for reproductions of images.
"This has a long way to go, but it is a start," Centeno said of his project.
For their studies on baboons, Altmann and Markham are grappling with the complexities of weather and climate. Short-term changes in the landscape, including dramatic shifts in daily temperatures and intense seasonal alterations of temperate climate interspersed with drought, occur against a backdrop of larger-scale ecological changes that accumulate over decades in this area of Kenya.
Understanding how organisms adapt to environmental change of this sort is crucial for biological conservation, Altmann said, because many parts of the world are now experiencing rapid climate and landscape changes. Alterations in behavior provide insights into population processes. Environmental change probably has been experienced by all organisms during their evolutionary history, and behavior is a key tool in response to change. "Our goal is to document in detail the diverse responses of the Amboseli baboons to the environmental change they are experiencing," Altmann said.
Using map coordinates detected by a global positioning satellite, the scientists have been able to enter those locations into the geographic information system at the Visualization Lab, producing detailed maps showing movement patterns of the animals. As a result, the researchers can view the entire Amboseli region with extreme clarity. Because the Amboseli baboon research is so extensive -- the project dates back to the early 1960s -- and is accessible through the Visualization Lab, researchers can interact with the data, see new patterns and run new analyses. Markham already has been able to electronically track and view multiple social groups of baboons for 600 days in the savannah habitat of Amboseli, Kenya.
Haldon is striving to model the movement of armies over pre-modern landscapes so he can analyze the historical impact of human populations on their environment. He also is trying to integrate traditional archaeological survey work with other disciplines and create a new, digital entity from those. The Avkat Archaeological Survey, based in north central Anatolia, an area now within modern Turkey, is designed to take advantage of traditional as well as nontraditional techniques, such as using large volumes of climate, vegetative and geological data from satellite images.
"We will be using new approaches to surface survey that are changing the way in which survey work is carried out, including challenges to traditional concepts of sampling, the need to excavate and the relationship of settlement to nonsettlement areas," Haldon said. "These need to be made relevant to the problems of understanding regional change over time, particularly with respect to settlement patterns, subsistence strategies and communications patterns."
Instruments for teaching
Kreike has found visualization techniques priceless instruments for teaching. Southern Africa, his main area of research, is an unknown territory to many of his students. The area changes dramatically between seasons and over time. In this case, he said, images are more powerful than words.
"I am a former museum curator and have always been very interested in visual sources and tools, including objects, photos, maps, posters, etc.," Kreike said. As part of his research, he has collected large numbers of very diverse visual sources, including century-old photos, series of aerial photos taken over time and satellite images. "My ultimate goal is to create a virtual historical world that will allow time travel -- a sort of Second Life but then with real historical individuals, homes and environments -- in which you can travel through time -- with or without an avatar -- and space."
His area of focus is on the border of Angola and Namibia, and he is interested in the era from the l940s to the present. "You will be able to visit the same village, family or in some cases even the same individual in 1943 and 1973 and see what the area looked like and what it was like," he said. "I will be able to take my students on a trip through history based on real historical images."
Burrows is using technology to "see" things he could only imagine but never view in any real way. He is particularly interested in supernovae -- vast, exploding stars that become extremely luminous in the process -- and in developing theories of the mechanism of explosion, detailing every aspect of the chain of events.
"Without good visualization tools, we would be blind concerning what these detailed and expensive simulations are telling us," Burrows said. "With visualization capabilities such as those that are now being provided by the PICSciE Visualization Lab, we can explore complicated features otherwise difficult to discern using other formats."
A video of his work is available online.
The lab has been funded mainly by PICSciE and the departments of astrophysical sciences, geosciences, mechanical and aerospace engineering, the School of Engineering and Applied Science, and the Office of Information Technology.


