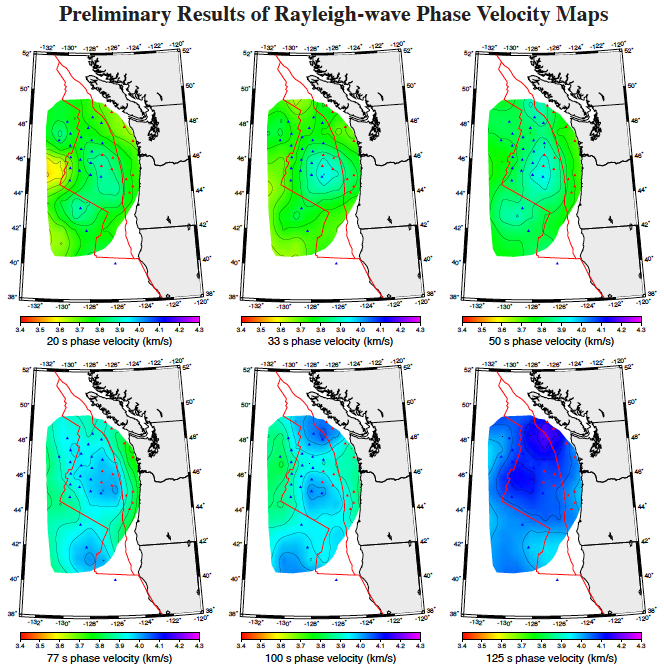
Adjoint tomography of Lithossphere and Asthenosphere beneath Juan de Fuca plateThe Cascadia Initiative is a four-year experiment (2011-2015) designed to study the structure of the Juan de Fuca oceanic plate and its interaction with the North American plate as it subducts beneath the continent. In this experiment, ocean-bottom seismometers will be repeatedly deployed over a four-year period to cover all of the Juan de Fuca plate. In addition, there are many land seismographs that will record seismic signals throughout the experiment. Based upon surface wave data, body wave data, and ambient noise data collected, we will construct as accurate and detailed a regional model of the crustal and upper mantle structure as possible to facilitate assessment of seismic and tsunami hazards in this area. One of the most powerful techniques for revealing details of the structure is full waveform modeling of signals from regional events. Our strategy for full waveform analysis will be to construct 3-D models based on array analysis of teleseismic events and ambient noise tomography as starting models. At this point, we will solve for the best hypocenters, origin times and moment tensors for the sources. With the new source information and 3-D starting models, we will apply spectral-element and adjoint methods to develop a three-dimensional seismic wave speed and attenuation (Q) model (In collaboration with Dr. Douglas Toomey, Univerisity of Oregon). 

Figure 1. Planned amphibious array deployment of seismographs. Yellow circles, first year, North deployment; yellow with red outline, second year south deployment. Light blue squares, Blanco deployment, which will also be open data; red circles, backbone or reference stations that will be deployed throughout the four years. These 4 components plus the land stations (dark blue) will provide the primary data used in this study. Yellow line, Juan de Fuca plate boundary. Red lines and box location of airgun profiling. Blue lines, depth contours to top of slab. |
Finite Frequency Effects on Surface-wave Amplitudes and phaseSurface wave tomography inversions based upon ray theory have resolution limits, when the length scale of heterogeneities is less than seismic wavelength finite frequency effects become important and need to be considered. We investigate finite frequency effects of surface waves in 3-D wave speed and 3-D anelasticity (Q) earth models. We simulate wave propagation in the models using a Spectral Element Method (SEM) and measure travel time and amplitude perturbations caused by lateral variations in wave speed and anelasticity for Rayleigh waves at period range of 50 s – 200 s. Comparisons between the “ground truth” SEM measurements with those predicted using ray theory and finite frequency theory show that finite frequency effects are stronger in surface-wave amplitudes than in travel times, especially at long periods. |
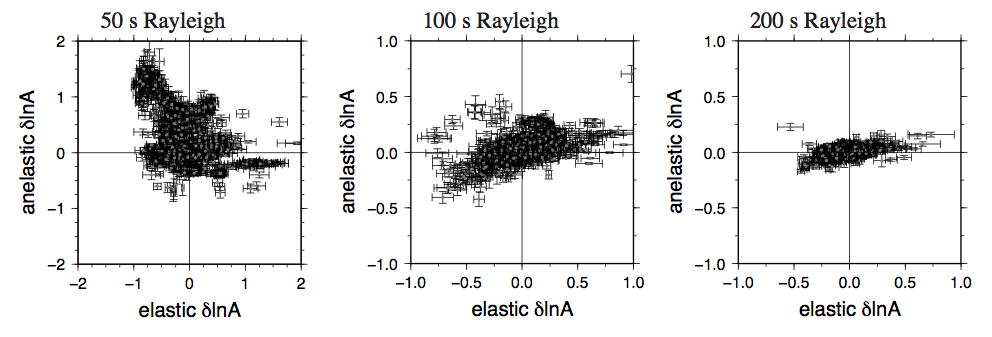
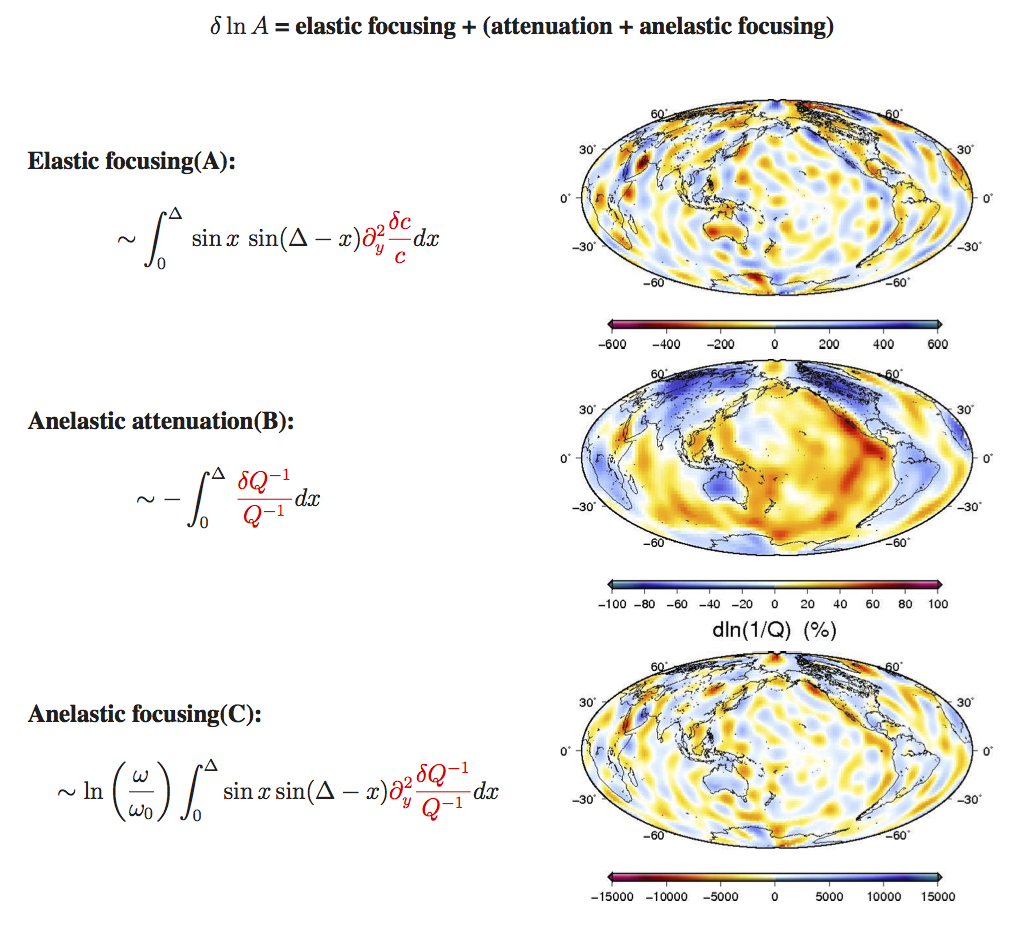
3D Anelastic Effects on Surface-wave AmplitudeWe investigate the effects of lateral perturbations in velocity and anelasticity (Q) on surface wave amplitudes based upon wave propagation simulations in 3-D earth models using a spectral element method (SEM). We construct 3-D Q models based upon a wave speed model S20RTS using a set of reasonable mineralogical parameters assuming lateral variations in both wave speed and anelasticity are due to temperature perturbations. We measure and compare amplitude perturbations of surface waves caused by 3-D wave speed (elastic) structures and those caused by 3-D anelastic (Q) structures at a period range of 50–200 s. The measurements show that influence of 3-D wave speed structures on amplitudes is comparable to that of 3-D Q structures at short period (50 s), but becomes dominant at longer periods. In ray theoretical framework, surface wave amplitudes can be decomposed into three terms—elastic focusing, anelastic attenuation and anelastic focusing—which depend, respectively, upon the roughness of phase velocity perturbations (∂2yδlnc), perturbations in anelasticity (δlnQ-1) and the roughness of perturbations in anelasticity (∂2yδlnQ-1). Ray-theoretical calculations confirm the relative importance of 3-D Q and 3-D wave speed in perturbing surface wave amplitudes and show that anelastic focusing effects, which have been ignored in present-day tomographic studies, have a more significant effect than attenuation. Therefore, the effects of 3-D Q structures can be ‘counter-intuitive’ at long period for surface waves travelling through a low-Q region may experience amplitude increase (Ruan & Zhou, 2012). 

Figure 1. Top: In this example, lateral wavespeed perturbations cause strong focusing effects while lateral Q perturbations only cause weak attenuation indicating the presence of anelastic focusing effects. Bottom: Comparison between anelastic effects and elastic focusing/defocusing on surface wave amplitudes as a function of wave period. 

Figure 2. Ray theory of surface wave amplitude perturbations (Zhou 2009) and ray-theoretical Predictions of anelastic effects and elastic focusing/defocusing on surface wave amplitudes based upon ray theory. |
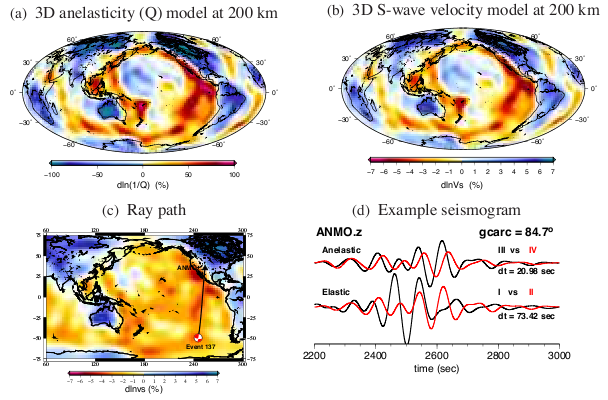
3D Anelastic Effects on Surface-wave Phase delaysLateral variations in anelasticity (Q) provide important constraints complementary to 3-D wave speed variations in mapping 3-D thermal and compositional structures in the mantle. In present-day joint tomographic inversions of global velocity and anelasticity (Q) structure, 3-D anelastic dispersion effects on surface waves have been ignored. In this work, we quantify the effects of 3-D Q structure on surface wave phase delays by simulating wave propagation in 3-D wave speed and 3-D Q models using a spectral element method (SEM). We compare phase delays caused by 3-D Q structure and those caused by 3-D velocity structure. Our results show that (1) roughly 15–20 per cent of the observed phase delays (traveltimes) in longperiod surface waves are due to 3-D Q structure; this implies that neglecting 3-D anelastic dispersion effects can lead to biased velocity models in seismic tomography; (2) the effects of Q perturbations on surface wave phase delays are frequency dependent as a result of local S-wave anelastic dispersion, frequency-dependent depth sensitivity of surface waves as well as the 3-D distribution of Q anomalies. In our numerical experiments, the significance of 3-D anelastic dispersion increases with wave period, and the frequency dependence is most apparent in the period range between 60 and 150 s and becomes weaker at 150–200 s and (3) assuming a thermal origin, anelastic delays caused by ‘hot’ anomalies (or advances caused by ‘cold’ anomalies) are correlated with elastic delays (or advances), but their relation is not linear: the ratio between anelastic and elastic delays (or advances) becomes larger for ‘hotter’ anomalies than for ‘colder’ anomalies (Ruan & Zhou, 2010).

Figure 1. 3-D anelasticity and wavespeed models at a depth of 100 km. (c) Ray path of the seismograms shown in (d). (d) Example vertical synthetic seismograms. Top seismogram pairs show effects of anelastic dispersion, they are generated in a 1-D Q model (black) and 3-D Q model (red), respectively. Bottom seismogram pairs show differences due to wave speed perturbations, they are generated in a 1-D wavespeed model (black) and 3-D wavespeed model (red), respectively. Delay times measured at 100 seconds using multi-taper technique are shown below the traces.

Figure 2. (a) Comparison between anelastic dispersions and elastic phase delays for 100 s Rayleigh. (b) Ratio of anelastic delays to elastic phase delays as a function of wave period. |
Earthquake TriggeringOn 26 December 2004, the MW 9.3 Sumatra earthquake occurred, generated a rupture which extended 1200 kilometers along the Andaman trough and lasted for more than 500 seconds. Only 30 minutes later, an MW 5.8 earthquake occurred 1600 km away, approximately centered in Namzang, Myanmar. It was submerged in the strong coda of great Sumatra earthquake; the contamination of waveform make it difficult to acquire more details of this earthquake. In our study, we construct crust structure in Shan plateau with H-k receiver function stacking algorithm, then model the local Pnl and surface wave as well as the teleseismic P waves of both Namzang earthquake and a MW 5.1 aftershock. The occurrence of this earthquake in a low seismicity region, and the time proximity with the great Sumatra earthquake both strongly suggest an earthquake triggering. By calculating the static and dynamic stress change in Namzang, which induced by the displacement and seismic wave of Sumatra earthquake respectively. we believe that the dynamic stress change could be the probable agent of triggering. Our study suggest that moderate or strong tectonic earthquake can be dynamically triggered even thousands kilometers away. |