 |
 |
 |
 |
 |
 |
 |
 |
 |
 |
 |
|
|
|
|
|
|
|
|
|
|
|
|
|
|
|
|
|
|
|
|
|
|
|
|
|
|
|
|
|
|
|
|
|
|
|
|
|
|
|
|
|
|
|
|
|
|
|
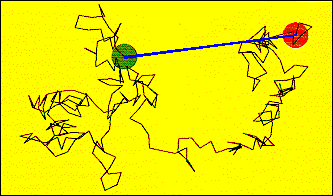
In
a random walk situation, individual 'steps' of a fixed length take place
sequentially, but the direction of the next step is uncorrelated with that
of the step just taken. The diagram illustrates this process for a sequence
of 256 steps confined to a plane. The green circle is centered on the start
location and has a radius equal to the step length. The red circle is centered
on the end point of the sequence. The blue line joining the start and finish
points has a length that depends upon the individual step size, a, and
the total number of steps, n. For this case:
L
= a(n)0.5. |
|
|
|
|
|
|
|
|
|
|
|
 |
|
|
|
|
|
|
|
|
|
|
|
|
|
|
|
From:
Cotterill, "The Cambridge Guide to the Material World," Cambridge (1989) |
|
|
|
|
|
|
|
|
|
|
|
|
|
|
|
|
|
|
|
|
|
|
|
|
|
Diffusion
steps behave in this way implying that the interval between jumps is long
compared to the time taken for the jumping atom to lose its excess energy
to the other lattice atoms. The random walk diagram is also a good
description of a macromolecule composed of n units (mers) of length a that
can make arbitrary angles with respect to each other. In this case the
distance between the free ends of the molecule will also be L
= a(n)0.5.
The configuration of the molecule has an entropy associated with it, and
as the molecule is straightened by stretching this configurational entropy
decreases. The change in free energy associated with this process contributes
to the elastic constant of the molecule. |
