| |
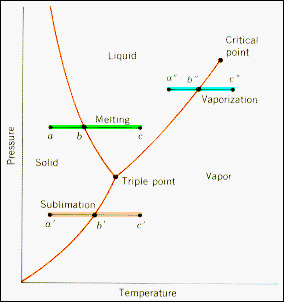
· The (p, T) projection of the surface of state for a material
that expands on freezing is shown opposite. Three constant pressure paths
that involve phase transitions are plotted on this diagram.
· The
green path, a-b-c, is a melting transition and the point b is the state
for which the solid and the liquid are in equilibrium (have the same Gibbs
function).
· The blue path, a"-b"-c", is
a boiling transition at another pressure. At b the liquid and its vapor are
in equilibrium.
· The orange path, a'-b'-c', is a sublimation
transition and b is the state for which the solid and its vapor are in thermodynamic
equilibrium. |
|
|
|
|
|
|
|
|
|
|
|
|
