Activation Energy and Temperature Dependence of Rates:
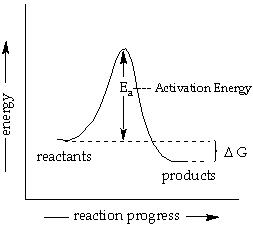
According to collision theory, molecules must collide to react. At a higher temperature, molecules move faster, and will collide more often. Also at a higher temperature, the reactant molecules carry more energy and there is a greater proportions of the collisions will have enough energy to lead to product. The Activation Energy (Ea) is the minimum energy that must be overcome for the reactant to proceed to products. See the reaction coordinate diagram below.

The Arrhenius equation relates the rate constant to temperature.
![]() (eqn
15)
(eqn
15)
where k is the rate constant
If we take the natural log (ln) of both sides of the Arrhenius equation we get
![]() (eqn
16)
(eqn
16)
and since the natural log of e is 1, eqn 16 simplifies to
![]() or
or ![]() (eqn
17)
(eqn
17)
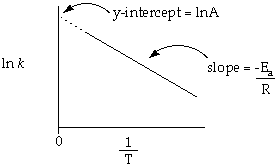
This is an equation for a straight line. A plot of ln k on the y-axis vs 1/T on the x axis will have a slope = -Ea/R and a y-intercept of ln A. We are interested in determining the Ea for the reaction.

For Runs 6-9 the [S2O82-] and [I-] are constant and only the temperature changes. From this data you will calculate the rate
![]() (eqn
10)
(eqn
10)
and rate constant, k.
![]() (eqn
14)
(eqn
14)
Again it is best to summarize the data in a table. For example
| Table III: Summary of Rates vs Temperature | |||||
|---|---|---|---|---|---|
| Run | Rate | Rate Constant (k) | ln k | Temperature (°C) | 1/T (K) |
| 6 | |||||
| 7 | |||||
| 8 | |||||
| 9 | |||||
Draw a graph of ln k vs 1/T following these basic guidelines:
Determine the value for Ea from the slope of the line through your data. One method for determining the slope and y-intercept is to perform a Least Squared Analysis. This is also referred to as a Linear Regression Analysis. Most graphical calculators or graphing programs are capable of this analysis. Otherwise you will determine these values from the graph.
![]() and
and ![]() (eqn
18)
(eqn
18)
You do not have to do an uncertainty analysis for any data in this experiment.
You also need to answer the discussion questions.